-
101 circular graph
-
102 motion-velocity graph
English-Russian big polytechnic dictionary > motion-velocity graph
-
103 high-low graph
The English-Russian dictionary general scientific > high-low graph
-
104 circular graph
-
105 load-graph
график нагрузки
—
[Я.Н.Лугинский, М.С.Фези-Жилинская, Ю.С.Кабиров. Англо-русский словарь по электротехнике и электроэнергетике, Москва, 1999 г.]Тематики
- электротехника, основные понятия
EN
кривая нагрузки
—
[Я.Н.Лугинский, М.С.Фези-Жилинская, Ю.С.Кабиров. Англо-русский словарь по электротехнике и электроэнергетике, Москва, 1999 г.]Тематики
- электротехника, основные понятия
EN
Англо-русский словарь нормативно-технической терминологии > load-graph
-
106 bar graph
- светодиодная шкала
- диаграмма, изображённая столбиками
диаграмма, изображённая столбиками
—
[ http://slovarionline.ru/anglo_russkiy_slovar_neftegazovoy_promyishlennosti/]Тематики
EN
светодиодная шкала
линейный индикатор
-
[Интент]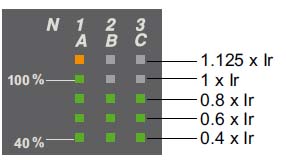
Рис. Schneider ElectricПараллельные тексты EN-RU
A bargraph on the front of the control unit continuously displays the currents measured on phases 1, 2 and 3 as a percentage of the long-time current setting Ir.
[Schneider Electric]Светодиодная шкала, расположенная на лицевой панели расцепителя, непрерывно отображает измеренные токи в фазах 1, 2 и 3, в процентах от уставки тока Ir защиты с длительной задержкой срабатывания.
[Перевод Интент]
Тематики
Синонимы
EN
Англо-русский словарь нормативно-технической терминологии > bar graph
-
107 slope of time-distance graph
- наклон годографа (сейсм.)
наклон годографа (сейсм.)
—
[ http://slovarionline.ru/anglo_russkiy_slovar_neftegazovoy_promyishlennosti/]Тематики
EN
Англо-русский словарь нормативно-технической терминологии > slope of time-distance graph
-
108 power-time diagram
график нагрузки
—
[Я.Н.Лугинский, М.С.Фези-Жилинская, Ю.С.Кабиров. Англо-русский словарь по электротехнике и электроэнергетике, Москва, 1999 г.]Тематики
- электротехника, основные понятия
EN
Англо-русский словарь нормативно-технической терминологии > power-time diagram
-
109 problem of graph isomorphism can be solved efficiency
Макаров: (i.e. in polynomial-time) проблема полиморфизма графов может быть решена эффективно (т.е. в полиномиальном времени)Универсальный англо-русский словарь > problem of graph isomorphism can be solved efficiency
-
110 the problem of graph isomorphism can be solved efficiency
Макаров: (i.e. in polynomial-time) проблема полиморфизма графов может быть решена эффективно (т.е. в полиномиальном времени)Универсальный англо-русский словарь > the problem of graph isomorphism can be solved efficiency
-
111 compile time computation
address computation — формирование адреса; вычисление адреса
computation graph — вычислительный граф; граф вычислений
-
112 real time processing
English-Russian dictionary of Information technology > real time processing
-
113 real-time processing
The English-Russian dictionary general scientific > real-time processing
-
114 slope of time-distance graph
Большой англо-русский и русско-английский словарь > slope of time-distance graph
-
115 broadside time-distance graph
English-Russian dictionary of geology > broadside time-distance graph
-
116 hyperbolic time-distance graph
English-Russian dictionary of geology > hyperbolic time-distance graph
-
117 observed time-distance graph
English-Russian dictionary of geology > observed time-distance graph
-
118 reflection time-distance graph
English-Russian dictionary of geology > reflection time-distance graph
-
119 refraction time-distance graph
English-Russian dictionary of geology > refraction time-distance graph
-
120 reversed time-distance graph
English-Russian dictionary of geology > reversed time-distance graph
См. также в других словарях:
Graph pebbling — is a mathematical game and area of interest played on a graph with pebbles on the vertices. Game play is composed of a series of pebbling moves. A pebbling move on a graph consists of taking two pebbles off one vertex and placing one on an… … Wikipedia
Time domain — is a term used to describe the analysis of mathematical functions, or physical signals, with respect to time. In the time domain, the signal or function s value is known for all real numbers, for the case of continuous time, or at various… … Wikipedia
Time tracking software — or timesheet software is accounting software which is used to maintain timesheets for each person in a company. Such software allows employees to enter their time, which can be approved/rejected by supervisors or project managers. Increasingly… … Wikipedia
Graph coloring — A proper vertex coloring of the Petersen graph with 3 colors, the minimum number possible. In graph theory, graph coloring is a special case of graph labeling; it is an assignment of labels traditionally called colors to elements of a graph… … Wikipedia
Graph automorphism — In graph theoretical mathematics, an automorphism of a graph is a form of symmetry in which the graph is mapped onto itself while preserving the edge vertex connectivity.Formally, an automorphism of a graph G = ( V , E ) is a permutation sigma;… … Wikipedia
Graph partition — The graph partitioning problem in mathematics consists of dividing a graph into pieces, such that the pieces are of about the same size and there are few connections between the pieces.Consider a graph G(V,E), where V denotes the set of vertices… … Wikipedia
Graph embedding — In topological graph theory, an embedding of a graph G on a surface Sigma; is a representation of G on Sigma; in which points of Sigma; are associated to vertices and simple arcs (homeomorphic images of [0,1] ) are associated to edges in such a… … Wikipedia
Time complexity — In computer science, the time complexity of an algorithm quantifies the amount of time taken by an algorithm to run as a function of the size of the input to the problem. The time complexity of an algorithm is commonly expressed using big O… … Wikipedia
graph — /graf, grahf/, n. 1. a diagram representing a system of connections or interrelations among two or more things by a number of distinctive dots, lines, bars, etc. 2. Math. a. a series of points, discrete or continuous, as in forming a curve or… … Universalium
Graph of desire — The graph of desire is a conceptual tool from the psychoanalytic theory of Jacques Lacan.HistoryLacan devised numerous quasi mathematical diagrams to represent the structure of the unconscious and its points of contact with empirical and mental… … Wikipedia
time/fuel graph — kuro suvartojimo kreivė statusas T sritis Standartizacija ir metrologija apibrėžtis Kuro suvartojimo priklausomybės nuo laiko kreivė. atitikmenys: angl. howgozit; time/fuel graph vok. Flugverlaufkurve, f rus. кривая зависимости расхода топлива от … Penkiakalbis aiškinamasis metrologijos terminų žodynas